Strategic Timing: Aligning Software Deployments with Seasonal Usage Patterns in Multi-Site Office Networks
Ines Beck · Sep 4, 2026
Strategic Timing: Aligning Software Deployments with Seasonal Usage Patterns in Multi-Site Office Networks
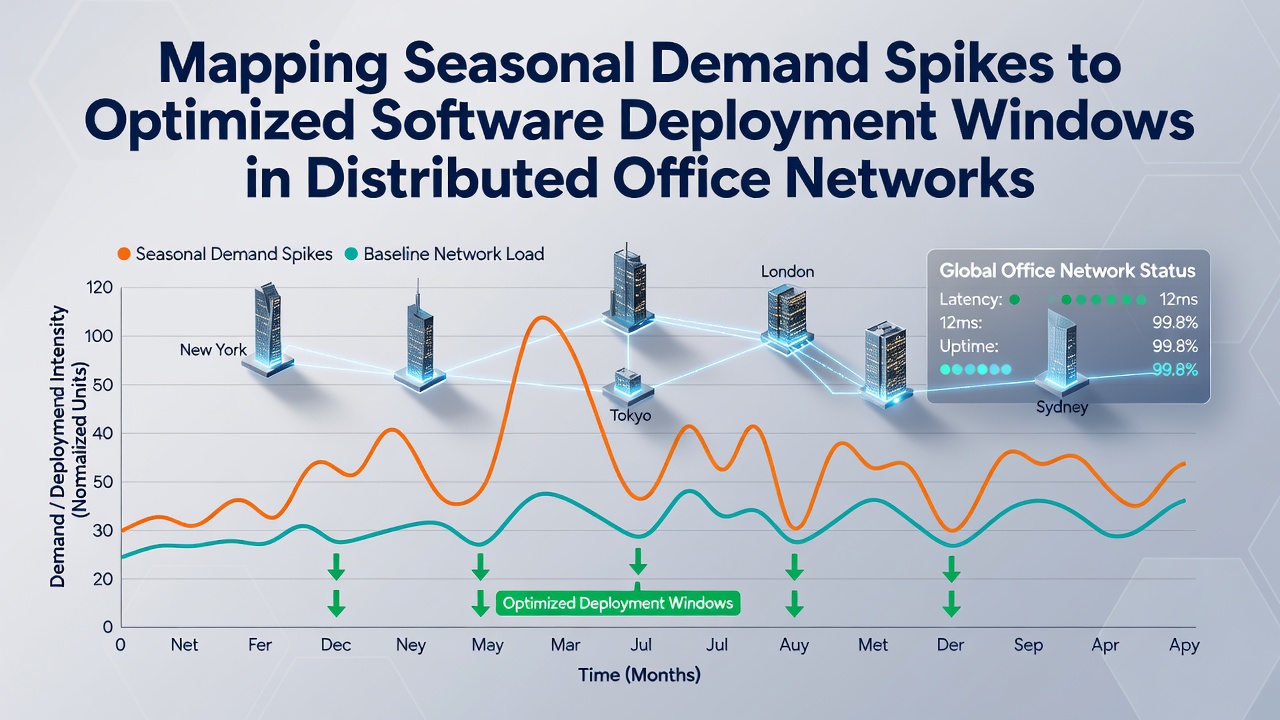
Organizations managing distributed office networks track usage data across multiple locations to identify when demand rises and falls throughout the year, and these patterns directly influence decisions about when to schedule software updates and deployments. Research indicates that demand often increases during fiscal reporting periods in the first and fourth quarters while dropping during summer months and holiday seasons in many regions, according to analyses of enterprise network logs from large corporations.
Tracking Demand Fluctuations Across Locations
Network administrators collect metrics such as login volumes, application access rates, and bandwidth consumption from branch offices to map seasonal variations, and these datasets reveal consistent peaks tied to business cycles like end-of-month reporting or annual budgeting processes. Studies from the European Union Agency for Cybersecurity show that organizations using centralized monitoring tools detect these spikes earlier than those relying on manual reports, which allows teams to adjust deployment calendars proactively. Data collected in September 2026 is expected to highlight post-summer recovery periods when activity rebounds after vacation slowdowns, providing another window for non-critical updates.
Distributed systems add complexity because each office may operate in different time zones and follow unique local calendars, yet aggregated analytics help identify overlapping low-demand periods suitable for coordinated rollouts. Observers note that companies with unified dashboards integrate weather data and regional events into their models, since external factors like severe storms or public holidays further suppress usage and create safer deployment intervals.
Selecting Deployment Windows Based on Evidence
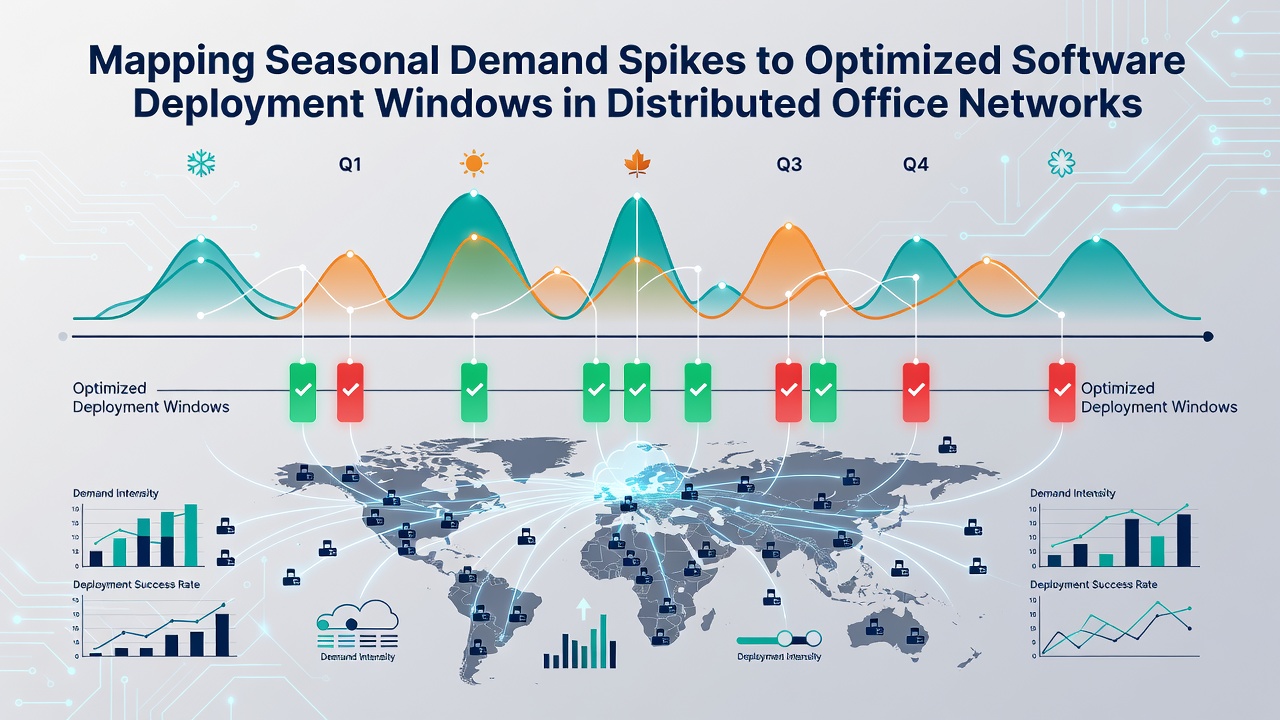
Teams prioritize windows when overall network load falls below 40 percent of capacity, according to operational guidelines issued by the National Institute of Standards and Technology, because this threshold reduces the risk of interrupting active user sessions. Automated scheduling systems compare historical patterns against real-time telemetry to recommend specific dates, and many enterprises schedule major releases during the second and third weeks of January or the last two weeks of July when activity consistently dips.
Multiple sites require staggered approaches where updates propagate from headquarters to regional hubs over several days, while satellite locations receive changes only after central validation confirms stability. Researchers discovered that organizations applying machine-learning models to past deployment logs achieve higher success rates by predicting exact hours when user activity bottoms out within each time zone.
Integration with Maintenance Cycles
Software deployment planning intersects with routine hardware checks and firmware updates, and coordinated calendars prevent overlapping activities that could compound downtime risks. Figures from industry reports reveal that firms synchronizing these tasks during identified low-demand periods experience fewer support tickets compared with those treating each category independently. Those who studied this know that permission cascades become simpler when fewer users remain logged in, allowing layered access controls to apply without widespread disruption.
Case examples include a North American retailer that shifted quarterly software patches to mid-August after reviewing three years of access logs, resulting in measurable reductions in rollback incidents. Another instance involved an Australian financial services group that aligned European and Asian office updates during overlapping holiday lulls, which minimized cross-region dependencies and shortened overall rollout duration.
Measuring Outcomes and Refining Models
Post-deployment reviews compare actual performance against predicted windows using key indicators such as user session duration, error rates, and help-desk volume, and these comparisons feed back into forecasting algorithms for subsequent cycles. Academic papers from research institutions in Canada document how iterative refinement of seasonal models improves accuracy by 15 to 20 percent over two-year periods when teams incorporate additional variables like remote-work policy changes. External links to authoritative datasets, such as those maintained by government statistical agencies, supply broader economic context that helps explain unusual spikes unrelated to internal business rhythms.
Continuous monitoring ensures that sudden events, including regulatory announcements or market shifts, receive prompt evaluation so deployment plans can pivot if demand patterns deviate from historical baselines. The reality is that distributed networks benefit most when mapping processes remain dynamic rather than static, allowing adjustments as new offices join the infrastructure or existing sites adopt hybrid schedules.
Conclusion
Mapping seasonal demand spikes to optimized deployment windows relies on systematic data collection, cross-location analysis, and iterative model updates that together reduce operational friction in distributed office environments. Organizations applying these methods document fewer interruptions and more predictable rollout outcomes when they ground schedules in verified usage patterns rather than fixed calendars. Continued refinement of these practices supports stable network performance as business conditions evolve through 2026 and beyond.